

Glossary
4-Year Graduation Rate
The 4-year graduation rate is actually a 4-year adjusted cohort graduation rate. It is the number of students who graduate in four years with a regular high-school diploma divided by the number of students who form the adjusted cohort for the graduating class rounded to the tenth. From the beginning of 9th grade, students entering that grade for the first time form a cohort. The cohort is later adjusted by adding any students who transfer into the cohort later during the 9th grade and over the next three years and subtracting any students who transfer out, move to another country, or die during that period. For more information, see https://dese.mo.gov/data-system-management/definitions-school-report-card-pages. https://dese.mo.gov/data-system-management/definitions-school-report-card-pages.
Academic Growth
While it is important to know the percentage of students in each school (or district) who are on grade level (proficient or above), it is also important to measure whether students are gaining more or less than a year’s worth of knowledge year over year. Tracking student academic growth over time is particularly important for schools (or districts) that serve high percentages of low-achieving students. While their proficiency rates may be low, if they generate higher-than-expected academic growth, they deserve credit. DESE developed a Growth Model that was piloted from 2010 to 2012. The purpose of the model is to identify systemic differences in student academic growth from one year to the next among schools or districts with similar baseline scores.
The Missouri Growth Model uses the four most recent years of Missouri Assessment Program (MAP) scores for English/language arts (ELA) and math for students in grades 3 through 8. Each student’s MAP scores in consecutive years are paired. For example, a student’s 2017 3rd-grade Math score would be paired with their 2018 4th-grade Math score to determine how much their math skills grew over those two years. The annual Growth score calculated can have up to three pairs of year-to-year growth scores per student in the school or district.
For each student, the model predicts what their score should be in the current year (this prediction will eventually be compared to their actual score). The prediction is based on the following factors:
- Their score for the prior year
- Whether they were in the building for less than one year
- The school’s (or district’s) prior year average score
- The school or district rate of mobility (the percentage of students in the school or district for less than one year).
Each student’s predicted score is compared to their actual score. The difference between the two is the residual.
The residuals are aggregated to the school or district level and converted to National Curve Equivalents (NCEs). An NCE is a statistic based on a normal curve where the average is 50, meaning that a school or district with average, growth would receive a score close to 50. A school or district with a score that is significantly lower than 50 fell short of its expected growth. A school or district with a score that is significantly higher than 50 exceeded its expected growth.
For more information on the Missouri Growth Model, see here https://dese.mo.gov/sites/default/files/mogrowthmodelstepbystep.pdf.
Achievement
The achievement indicators are based on the Missouri Assessment Program (MAP)–a yearly standards-based test that measures specific skills defined for each grade by the state of Missouri. For more information on the standards, see https://dese.mo.gov/college-career-readiness/curriculum/missouri-learning-standards. All students in grades 3 through 8 take the grade-level assessments. High school students take End of Course (EOC) exams. The scores for Algebra I (or Algebra II if a student completed Algebra I prior to high school) are used for math, and the scores for English II are used for English/language arts.
Achievement Levels in English/Language Arts or Math
According to DESE, a student’s performance on the annually administered Missouri Assessment Program (MAP) falls into one of four categories, as follows:
- Below Basic—the student has only a minimal understanding of the material.
- Basic—the student has a partial understanding of the material.
- Proficient—the student has an “adequate” understanding and is able to apply subject matter as defined by the Missouri Learning Standards.
- Advanced—the student demonstrates a “thorough” understanding and ability to apply subject matter.
For the purposes of this website, the “Proficient” and “Advanced” categories are combined into the “percent Proficient or above.” For more information, see https://dese.mo.gov/college-career-readiness/assessment/guide-missouri-assessment-program.
ACT Composite Score
The ACT is a college entrance exam most high school students take during their senior year. The exam contains four multiple-choice tests—English, math, reading, and science. These tests measure skills that are important for success in postsecondary education and that are acquired during secondary education. The scores for each test range from 1 to 36. The composite score is the average of the four test scores rounded to the nearest whole number. For more information, see http://www.act.org/content/act/en/products-and-services/the-act-educator/the-act-test.html.
Adjusted Achievement and the Difference Between Actual vs. Expected
To some degree, rates of proficiency may reflect student demographics. Disadvantaged students often lack access to the same resources outside of schools as their more advantaged peers. However, serving disadvantaged students does not excuse low performance. To understand the impact of student demographics on performance, the Show-Me Institute performed regression analyses at the school and district levels in English/language arts (ELA) and math. The analyses regressed the percentage of proficient or above students in each of the four cases on the percentage of low-income enrollment, as defined by free/reduced price lunch (FRPL) status. These models were run for every school (or district) in the state with scores to determine how proficiency scores and low-income enrollment are related in Missouri.
Each of the regression analyses resulted in a baseline rate of proficiency for schools or districts with no low-income students and a rate of expected reduction in proficiency for each additional percentage point of low-income enrollment. For example, in the school-level ELA model, a school with no low-income enrollment would be expected to report a rate of 66.75% proficiency. For each percentage point of low-income enrollment, that rate would be expected to decline by 0.41 points. A school with 10 percent low-income enrollment, therefore, would be expected to report a rate of proficiency of 62.65% (66.75% – (10 * .41)).
For each school or district, the percentage of low-income enrollment was multiplied by the baseline rate and subtracted from the baseline. The result is the school’s (or district’s) predicted score. If a school’s (or district’s) expected score is higher than its actual score, it underperformed. If a school’s (or district’s) expected score is lower than its actual score, it overperformed.
Blue Ribbon School
The National Blue Ribbon Schools Program is administered by the U.S. Department of Education. The program recognizes schools based on their overall academic excellence or their progress in closing achievement gaps. Schools are nominated by their state education agency (in Missouri’s case, the Missouri Department of Elementary and Secondary Education [DESE]). At least one third of the public schools nominated by each state must have a high percentage of students from disadvantaged backgrounds. For more information, see https://www2.ed.gov/programs/nclbbrs/index.html.
Comprehensive Support and Improvement (CSI) Schools
Low-performing schools serving low-income students may be identified for Comprehensive Support and Improvement under the federal Every Student Succeeds Act. Index scores based on proficiency in English/language arts, proficiency in math, graduation rate, and English language acquisition for non-native English speakers—are calculated for all schools that receive federal funding for low-income students under the Title I program. The five percent of schools scoring lowest in overall achievement are identified as Comprehensive Support and Improvement (CSI) schools. The cut score for the lowest five percent of schools (that is, the highest overall score that is still among the lowest five percent of scores) is used to identify Targeted School Improvement (TSI) schools as well. For more information, see https://dese.mo.gov/media/pdf/understanding-identification-comprehensive-school-improvement-csi-under-every-student.
Full-time equivalent teachers
Teachers are measured as full-time equivalent (FTE), as they are sometimes assigned to more than one school. In such cases, each school records a partial FTE for that staff member.
Grade Point Average (GPA)
In order to summarize the performance of each Missouri school and district, the grades assigned to each of the ten categories of performance were consolidated into a single grade point average (GPA). The GPA calculation is similar to an academic GPA. A’s receive 4 points, B’s receive 3 points, C’s receive 2 points, D’s receive 1 point, and F’s receive no points. The GPAs were then consolidated into four categories: 3.0–4.0, 2.0–2.99, 1.0–1.99, and 0.0–0.99.
Locale
The National Center for Education Statistics (NCES) revised its definitions of school locale types in 2006 after working with the Census Bureau to create a new locale classification system. NCES has classified each school into one of the following 12 categories based on schools’ actual addresses and their corresponding coordinates of latitude and longitude.
The new system is referred to as “urban-centric” to distinguish it from the previous “metro-centric” classification system. It has four major locale categories—city, suburban, town, and rural. Each of these is further divided into three subcategories.
Exhibit A: NCES’s urban-centric locale categories, released in 2006
| LOCALE | DEFINITION |
|---|---|
| City | |
| Large | Territory inside an urbanized area and inside a principal city with population of 250,000 or more |
| Midsize | Territory inside an urbanized area and inside a principal city with population less than 250,000 and greater than or equal to 100,000 |
| Small | Territory inside an urbanized area and inside a principal city with population less than 100,000 |
| Suburb | |
|---|---|
| Large | Territory outside a principal city and inside an urbanized area with population of 250,000 or more |
| Midsize | Territory outside a principal city and inside an urbanized area with population less than 250,000 and greater than or equal to 100,000 |
| Small | Territory outside a principal city and inside an urbanized area with population less than 100,000 |
| Town | |
|---|---|
| Fringe | Territory inside an urban cluster that is less than or equal to 10 miles from an urbanized area |
| Distant | Territory inside an urban cluster that is more than 10 miles and less than or equal to 35 miles from an urbanized area |
| Remote | Territory inside an urban cluster that is more than 35 miles from an urbanized area |
| Rural | |
|---|---|
| Fringe | Census-defined rural territory that is less than or equal to 5 miles from an urbanized area, as well as rural territory that is less than or equal to 2.5 miles from an urban cluster |
| Distant | Census-defined rural territory that is more than 5 miles but less than or equal to 25 miles from an urbanized area, as well as rural territory that is more than 2.5 miles but less than or equal to 10 miles from an urban cluster |
| Remote | Census-defined rural territory that is more than 25 miles from an urbanized area and is also more than 10 miles from an urban cluster |
Source: Office of Management and Budget (2000). Standards for Defining Metropolitan and Micropolitan Statistical Areas; Notice. Federal Register (65) No. 249.
These twelve categories are based on concepts the Census Bureau uses to define an area’s urbanicity: principal city, urbanized area, and urban cluster. A principal city contains the primary population and economic center of a metropolitan statistical area. A metropolitan statistical area is defined as one or more contiguous counties that have a “core” area with a large population nucleus and adjacent communities that are highly integrated economically or socially with the core. Urbanized areas and urban clusters are densely settled “cores” of Census-defined blocks with adjacent densely settled surrounding areas. Core areas with populations of 50,000 or more are designated as urbanized areas. Core areas with populations between 2,500 and 50,000 are designated as urban clusters. Rural areas are designated by the Census Bureau as those areas that do not lie inside an urbanized area or urban cluster.
For the purposes of this website, the 12 categories have been collapsed into 4. For more information, see https://nces.ed.gov/surveys/ruraled/definitions.asp.
Low-income Students
For the purposes of this analysis, low-income students are those who are eligible for free or reduced-price lunch in the National School Lunch Program administered by the U.S. Department of Agriculture. To be eligible for free lunch, a student must be from a household with an income at or below 130 percent of the federal poverty guideline. To be eligible for reduced-price lunch, a student must be from a household with an income between 130 percent and 185 percent of the federal poverty guideline. For more information, see https://dese.mo.gov/college-career-readiness/assessment/guide-missouri-assessment-program. Districts report the numbers of eligible students in each school on the last Wednesday in January to DESE. It is possible for schools or districts with high but not universal FRPL eligibility to assume all students are eligible via the Community Eligibility Program (CEP). However, the test score data reflected here are for those students identified as MAP free and reduced-price lunch in the DESE source files.
Rank
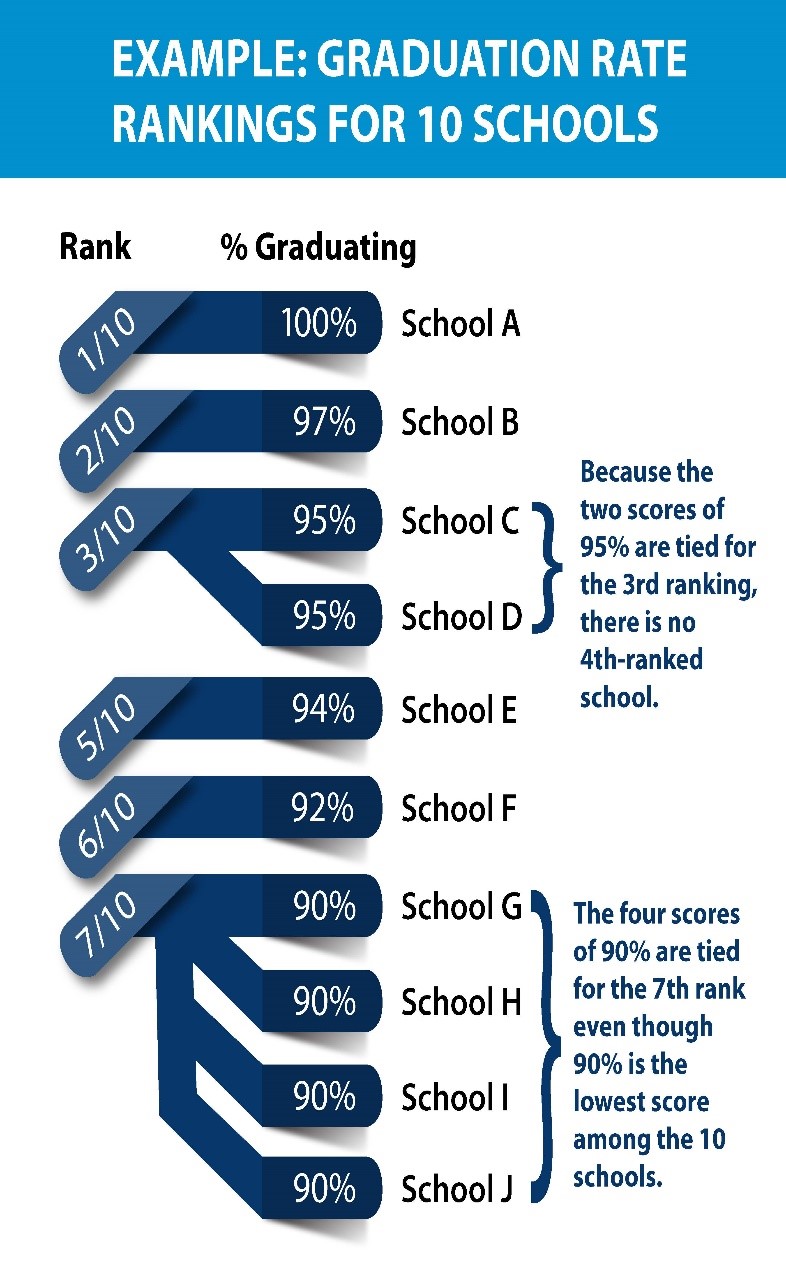 The Rank is determined by putting the schools or districts in order from the highest value of the graded item to the lowest value. The school or district with the highest value would receive a Rank of 1, meaning that it performed the best of all of the schools or districts that had scores for that item. The denominator displayed for each Rank is the total number of schools or districts that had valid scores for that item. In some cases, several schools or districts have the same value on an item and, therefore, they would receive the same Rank. If multiple schools or districts had the lowest possible score for an item (for example, if 0% of their students scored Proficient or higher in math), then they would share the lowest possible rank. In this case, the lowest possible rank would not be the same as the total number of schools or districts with valid scores on that item (the denominator of the Rank). For example, if 100 high schools had valid graduation rates and 10 schools had the lowest rate of 70%, then those 10 schools would all share the Rank of 90/100.
School Type: Regular Traditional, Regular Charter, Magnet
The Missouri School Report Cards only contain data for “regular” and “magnet” schools. The U.S. Department of Education classifies public schools by type. A “regular” school provides education that does not focus primarily on special education, vocational/technical education or alternative education, or any of the particular themes associated with magnet/special program emphasis schools. Regular schools may either be administered by a local school district or operate under a charter granted for a limited time and overseen by an authorizer. “Magnet” schools provide an academic or social focus on a particular theme. Accordingly, traditional public and charter schools constitute “regular” schools. Magnet schools may have entrance requirements.
Students with Disablilities
Students with disabilities receive special education and related services under the Individuals with Disabilities Education Act (IDEA), according to an Individualized Education Plan (IEP), Individualized Family Service Plan (IFSP), or a service plan. IDEA is a federal law enacted in 1990 and reauthorized in 2004.
Targeted School Improvement (TSI) Schools
Low-performing schools may be identified for Targeted School Improvement (TSI) under the federal Every Student Succeeds Act (ESSA). An index score that factors in proficiency, graduation, and attendance rates is generated and then compared to the list of Comprehensive Support and Improvement (CSI) schools, which are the lowest-performing five percent of schools in the state. If a school’s index score falls into the same range as the CSI schools, then it is identified as a TSI, or targeted, school. For more information, see https://dese.mo.gov/media/pdf/understanding-identification-targeted-school-improvement-under-every-student-succeeds-act.
Total Expenditures and Per-Pupil Expenditures
The total expenditures reported at the school or district level is the per-pupil amount multiplied by the number of pupils. The district-level per-pupil expenditures include all spending at the district level as reported in the Finance Data and Statistics Summary for All Districts file produced by DESE. These data exclude capital outlay, debt service, community services, non-instruction/support, and adult education expenditures. As of the 2018–19 school year, districts must submit to DESE the per-pupil expenditures for each school. DESE has released building-level per-pupil expenditures for both 2019 and 2020.